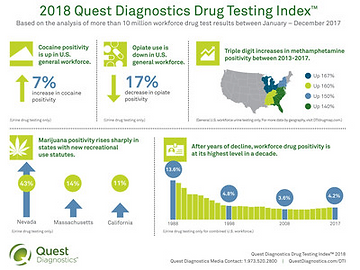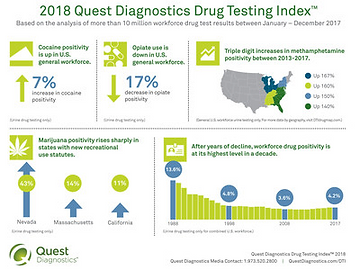
Nationally, the positivity rate for the combined U.S. workforce held steady at 4.2 percent in 2017, the same as in 2016, but a dramatic increase over the 3.5 percent positivity rate from 2012, which represented a thirty-year low. The analysis of 2017 data also suggests shifting patterns of drug use, with cocaine and amphetamines positivity surging in some areas of the country and marijuana positivity rising sharply in states with newer recreational use statutes. Prescription opiate positivity rates declined dramatically on a national basis.
For an interactive map with positivity rates and trend lines by three-digit zip code in the United States, visit www.DTIDrugMap.com.
The findings were unveiled today at the Federal Transit Administration (FTA) Drug and Alcohol Program National Conference in Ft. Lauderdale, Florida. 2018 marks thirty consecutive years of the Quest Diagnostics Drug Testing Index™ (DTI), an analysis of national workplace drug positivity trends based on the company’s de-identified laboratory data. The DTI has revealed insights into drug use in the United States since the Drug-Free Workplace Act was signed into law in 1988. In 1988, the DTI analysis found that the overall drug positivity rate among American workers was 13.6 percent.
“It’s unfortunate that we mark 30 years of the Drug-Free Workplace Act with clear evidence that drugs continue to invade the country’s workplaces. Not only have declines appeared to have bottomed out, but also in some drug classes and areas of the country drug positivity rates are increasing,” said Barry Sample, PhD, senior director, science and technology, Quest Diagnostics. “These changing patterns and geographical variations may challenge the ability of employers to anticipate the ‘drug of choice’ for their workforce or where to best focus their drug prevention efforts to ensure a safe and healthy work environment.”
Cocaine positivity increases overall, jumps sharply in some areas
The positivity rate for cocaine increased for the fifth consecutive year in the general U.S. workforce across every specimen type. In urine testing, the most common drug test specimen type, the positivity rate for cocaine increased seven percent in the general U.S. workforce (0.28% in 2016 versus 0.30% in 2017). Year-over-year increases were also observed in the general U.S. workforce in oral fluid testing (up 16%) and hair testing (19%).
In the federally-mandated, safety-sensitive workforce, for which only urine testing is permitted, cocaine positivity increased by eleven percent (0.28% in 2016 versus 0.31% percent in 2017), representing the third consecutive year of increases in this workforce segment.
A new pattern emerged in this year’s analysis, with cocaine positivity in urine testing increasing significantly in certain states among the general U.S. workforce. Double-digit year-over-year increases in at least four of the five past years were seen in the states of Nebraska (91% increase between 2016 and 2017), Idaho (88% increase), Washington (31%), Nevada (25%), Maryland (22% increase), and Wisconsin (13%).
Methamphetamine positivity skyrockets in Midwest and South regions
An analysis of trends in the general U.S. workforce based on the four U.S. Census regions identified large increases of methamphetamine positivity rates. Between 2013 and 2017, methamphetamine positivity increased: 167 percent in the East North Central division of the Midwest (Illinois, Indiana, Michigan, Ohio, Wisconsin);160 percent in the East South Central division of the South (Alabama, Kentucky, Mississippi, Tennessee); 150 percent in the Middle Atlantic division of the Northeast (New Jersey, New York, Pennsylvania); and 140 percent in the South Atlantic division of the South (Delaware, District of Columbia, Florida, Georgia, Maryland, North Carolina, South Carolina, Virginia, West Virginia). The percentage increase in these four divisions ranged between nine percent and 25 percent between 2016 and 2017.
“Thirty years in, this year’s results again demonstrate the ever-evolving threat that substance abuse poses to workplace safety. With the prescription opiate crisis filling the headlines, the significant drop in opiate positivity is a promising sign,” said Matt Nieman, General Counsel, Institute for a Drug-Free Workplace and Principal, Jackson Lewis P.C. “Yet, the ten-year high in positivity rates—spurred by nationwide surges in cocaine and methamphetamine positivity as well as double-digit marijuana spikes in states with newly implemented recreational laws—serves as a stark warning that efforts to prevent substance abuse in the workplace are as important today as ever.”
Prescription opiates continue decline in workforce testing data
“The depth of our large-scale analysis supports the possibility that efforts by policymakers, employers, and the medical community to decrease the availability of opioid prescriptions and curtail the opioid crisis is working to reduce their use, at least among the working public,” said Kim Samano, PhD scientific director, Quest Diagnostics.
Nationally, the positivity rate for opiates in the general U.S. workforce in urine drug testing declined 17 percent between 2016 and 2017 (0.47% versus 0.39%). More notably, oxycodones (oxycodone and/or oxymorphone) positivity declined 12 percent between 2016 and 2017 (0.69% vs. 0.61%), hydrocodone positivity declined 17 percent (0.81% vs. 0.67%); and hydromorphone positivity declined 22% (0.59% vs. 0.46%). Opiates other than codeine were at their lowest positivity rate in more than a decade.
The company’s workforce drug testing services generally test for drugs and metabolites associated with prescription opiates and semi-synthetic opiates. They do not typically test for synthetic opioids, such as fentanyl and its synthetic analogs.
Prescription opiate testing for the federally-mandated, safety-sensitive workforce has not been required until recently. Such testing was implemented in October 2017 for certain U.S. government employees. Preliminary data in the fourth quarter of 2017 from the testing of these workers indicates a positivity rate slightly higher than for the opiate group prior to these new regulations which only included codeine and morphine. Prescription opiate testing for safety-sensitive transportation workers covered under U.S. Department of Transportation (DOT) rules went into effect in January 2018.
According to the Centers for Disease Control (CDC), the overall national opioid prescribing rate in 2017 fell to the lowest it had been in more than 10 years, though rates vary by state and are high in some areas of the country.i
Urine drug test results for heroin, indicated by the presence of the 6-acetylmorphine (6-AM) metabolite, also declined in the general U.S. workforce (0.033% positivity, a three-year low and down nearly 11 percent in 2017 compared to 2016). There have been concerns by some public health experts that a reformulation of OxyContin, a popular opioid medication, has led to a corresponding increase in heroin use,ii which has been reflected in the Drug Testing Index data where 6-AM positivity more than doubled between 2011 and 2015. Data from 2016 and 2017 suggests this may be abating among workers subject to drug testing.
Marijuana positivity is up in states with new legalization statutes
Overall, marijuana positivity continued its five-year upward trajectory in urine testing for both the general U.S. workforce and the federally-mandated, safety-sensitive workforce. Marijuana positivity increased four percent in the general U.S. workforce (2.5% in 2016 versus 2.6% in 2017) and nearly eight percent in the safety-sensitive workforce (0.78% versus 0.84%).
Increases in positivity rates for marijuana in the general U.S. workforce were most striking in states that have enacted recreational use statues since 2016. Those states include: Nevada (43%), Massachusetts (14%) and California (11%). These three states also saw significant increases in marijuana positivity in federally-mandated, safety-sensitive workers: Nevada (39%), California (20%), and Massachusetts (11%). Federally-mandated, safety-sensitive workers include pilots, rail, bus and truck drivers, and workers in nuclear power plants, for whom routine drug testing is required by the DOT.
“These increases are similar to the increases we observed after recreational marijuana use statues were passed in Washington and Colorado,” said Dr. Sample. “While it is too early to tell if this is a trend, our data suggests that the recreational use of marijuana is spilling into the workforce, including among individuals most responsible for keeping our communities safe. We encourage policy analysts to track these trends closely to determine whether a correlation between the state legalization of marijuana and increased workforce drug use, as suggested by our data, bears out in other research.”


